Debugging
Finding and fixing bugs is an important part of the hardware and software development process. Sometimes you also need to use debugging techniques to understand how the system works. Two tools that are helpful are debug logging and debugging using the GNU Debugger (gdb).
Debug Logging
NuttX has a powerful system logging facility (syslog) with info, warn, and error levels. You can enable
debugging for your build for the subsystem or feature by using the menuconfig system.
$ make menuconfig
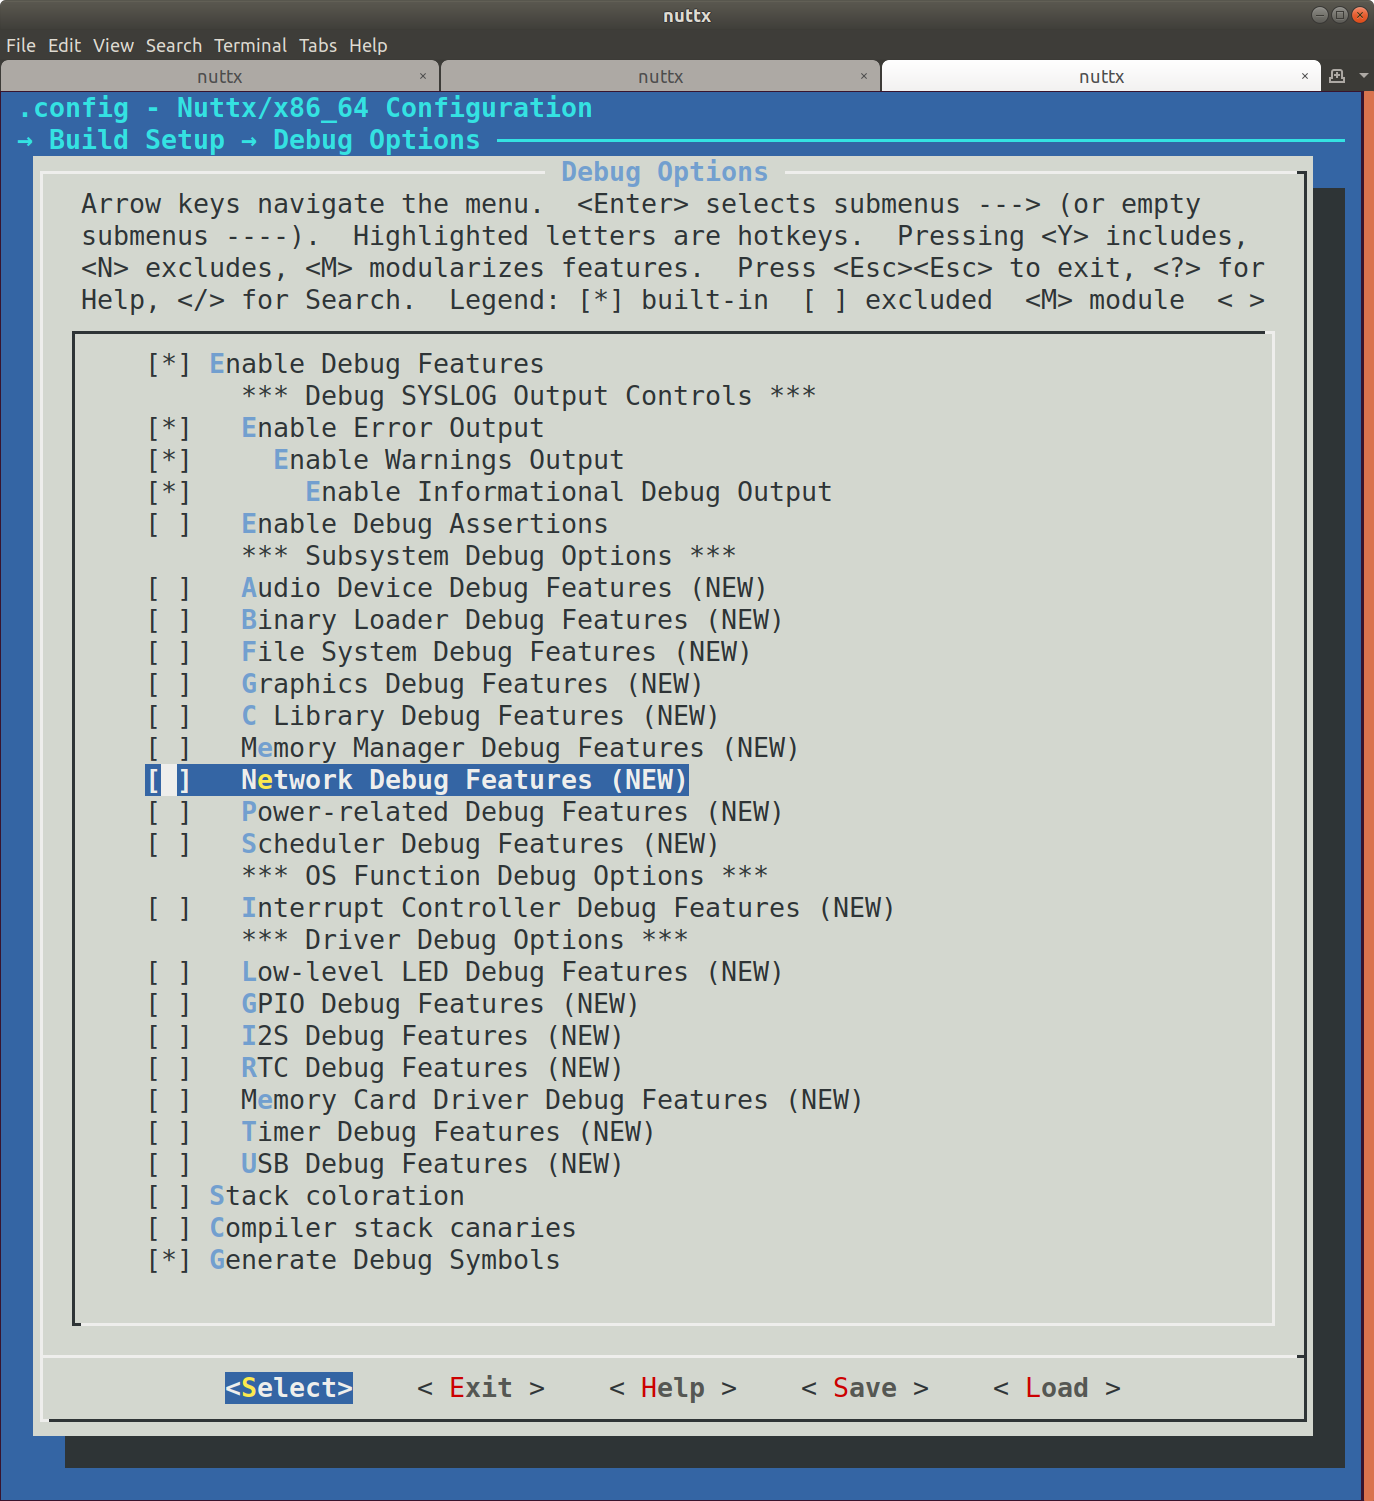
The debug options are available under Build Setup > Debug Options. You will most likely have to enable the
following options:
Enable Debug Features— selecting this will turn on subsystem-level debugging options, they will become visible on the page below. You can then select the ones you want.Enable Error Output— this will only log errors.Enable Warnings Output— this will log warnings and errors.Enable Informational Debug Output— this will produce informational output, warnings, and errors.
You can then select from the subsystems that are available, Network, Scheduler, USB, etc. Note that you will need to
separately enable the subsystem elsewhere in the menuconfig system. To see the CONFIG define that is set,
use the arrow keys to highlight the subsystem (for instance, Network Debug Features) and type ‘?’. This will show
you that the C macro that is set is called CONFIG_DEBUG_NET. debug.h defines the netinfo() logging
function that will log output if this macro is set. You can search the source code for netinfo to see how it is
used.
Note that enabling all these will produce an incredible amount of logging output. Enable the level you want and the area you’re interested in, and leave the rest disabled, save the config, and then recompile. You can see the full list of debug feature logging functions in the file debug.h.
Syslog timestamps can be enabled in the menuconfig system using Device Drivers > System Logging > Prepend
timestamp to syslog message (CONFIG_SYSLOG_TIMESTAMP).
You may need to do a little bit of experimenting to find the combination of logging settings that work for the problem
you’re trying to solve. See the file debug.h
for available debug settings that are available. This can also be configured via the menuconfig system.
There are also subsystems that enable USB trace debugging, and you can log to memory too, if you need the logging to be faster than what the console can output.
Changing Debug Settings Quickly
You can use the kconfig-tweak script that comes with the kconfig-frontends tools to quickly change debug settings,
for instance turning them on or off before doing a build:
$ kconfig-tweak --disable CONFIG_DEBUG_NET
$ make olddefconfig  # needed to have the kconfig system check the config
$ kconfig-tweak --enable CONFIG_DEBUG_NET
$ make olddefconfig
You can put a bunch of these into a simple script to configure the logging the way you want:
#!/bin/bash

kconfig-tweak --disable CONFIG_DEBUG_ALERT
kconfig-tweak --disable CONFIG_DEBUG_FEATURES
kconfig-tweak --disable CONFIG_DEBUG_ERROR
kconfig-tweak --disable CONFIG_DEBUG_WARN
kconfig-tweak --disable CONFIG_DEBUG_INFO
kconfig-tweak --disable CONFIG_DEBUG_ASSERTIONS
kconfig-tweak --disable CONFIG_DEBUG_NET
kconfig-tweak --disable CONFIG_DEBUG_NET_ERROR
kconfig-tweak --disable CONFIG_DEBUG_NET_WARN
kconfig-tweak --disable CONFIG_DEBUG_NET_INFO
kconfig-tweak --disable CONFIG_DEBUG_SYMBOLS
kconfig-tweak --disable CONFIG_DEBUG_NOOPT
kconfig-tweak --disable CONFIG_SYSLOG_TIMESTAMP
make oldconfig
JTAG Debugging
JTAG is a set of standards that specify a way to attach a hardware device to your embedded board, and then remotely control the CPU. You can load code, start, stop, step through the program, and examine variables and memory.
This guide assumes your board has a JTAG connector, and you have a JTAG hardware debugger like a Segger J-Link or OpenOCD.
The NuttX operating system uses threads, so you need a thread-aware debugger to do more than load code, start, and stop it. A thread-aware debugger will allow you to switch threads to the one that is running the code you’re interested in, for instance your application, or an operating system network thread. So far, OpenOCD is the only supported NuttX thread-aware debugger.
You will need an OpenOCD-compatible hardware adapter, ideally a fast one (USB 2.0 High Speed). This guide assumes you are using the Olimex ARM USB TINY H. (Olimex ARM USB TINY H on Amazon.) Other adapters may work, follow the OpenOCD instructions and the instructions that came with your adapter.
You’ll need to use the Sony fork of OpenOCD. Download and install it according to the OpenOCD instructions.
See this article for more info: Debugging a Apache NuttX target with GDB and OpenOCD.
See the section Running for a brief tutorial on how to use GDB.
Next up is Directory Structure.